Forex figures
Page 1 of 1

Forex figures
![]() by Evgenia Gencheva Mon Oct 17, 2016 6:56 pm
by Evgenia Gencheva Mon Oct 17, 2016 6:56 pm
Forex figures
Wedge
The wedge typically shows reversal of the trend, which is formed within the figure. The wedge is similar in structure to the symmetrical triangle, although approaching the wedge trend lines are inclined in the upward or downward, in contrast to the more homogeneous trend lines of the triangles. They also differ in meaning since the wedge is a longer-term formation. Wedges are divided into two types - up and down - as their main difference is in the slope of the formation.
Ascending wedge
The upward spike is usually considered bearish figure, indicating that the price will probably decrease. Approaching lines of support and resistance are in an upward direction. Since buyers are unable to raise the price higher and higher, sellers begin to pick up speed. The figure is completed when the price falls below the support level and sellers take control of the instrument.
The signal for the deal appears after a real breakthrough line of support. The objectives are defined like symmetrical triangles, using a bottom forming line of support. The first target point gain will be achieved in almost all cases (90%), the second point will be reached in 75% and the third 65% of cases.

Descending wedge
The downward wedge is bullish figure that suggests that the more likely the price to break up and form an uptrend. Trend lines are collected by both downhill as the price moves in a downtrend. The line resistance of the descending wedge is usually more severe than the line of support. A flattest support shows that sellers become weaker because cannot fail to push the price down.
The signal trading occurs after a real breakthrough line of resistance. It is important to make sure that the price has closed above the resistance. The objectives are defined by the peaks that form the line of resistance.

Head and shoulders
The formation head and shoulders is very popular among traders. This is a figure with three top that looks like a head with two shoulders. It usually signals a pending reversal, suggesting that the price will probably go against the previous trend. There are two types of head and shoulders - standard and reversed. Both show weakening trend with lower highs and lows.
Standard head and shoulders
The standard figure head and shoulders can be formed on top of an upward trend and this is an indication that the price will be lowered after its establishment. Head (central peak) stands above the shoulders (lower highs) that reach the same or very similar levels. Line support for all three tops is formed by connecting two bottoms and called neck.
The first lowest point suggests that demand for purchases begins to weaken. Investors who believe that the instrument is too low price, meet with purchase, followed by a flood of sales. This decline is followed by other percussion purchases that disappear earlier. Eventually the price drops to their true value below its original cost.
The figure is completed when after formation of the second shoulder neck is pierced. This is when most traders have to get into position. The goal is determined by calculating the distance between the top of the head and neck, and is projected downward to define the lower end, in this example 1.8150. After reaching this level, the price is expected to stop and turn.

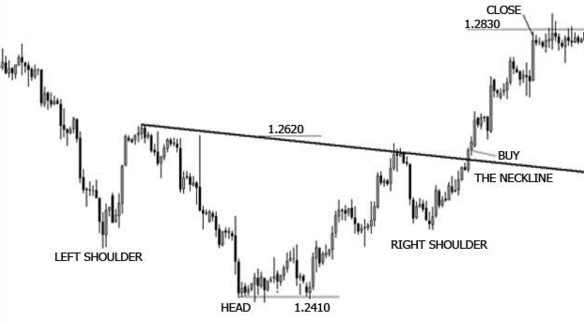
Inverted head and shoulders
The figure reversed head and shoulders is formed during the downward trend and it is usually a signal that the price will rise after the figure is complete. Like the standard head and shoulders, this model consists of two shoulders and head - which is on the level of resistance.
Inverted head and shoulders is completed when price break neck. This signals the opening of the deal. The objective is defined in the same way as the standard figure; by measuring the distance between the head and neck and projecting upwards to determine a higher purpose, in this case 1.2830.
Double top and double bottom
Double top and double bottom are two of the most reliable reversal figures used to determine whether this trend can be reversed. These two figures show efforts to keep the price direction in the same trend. After several attempts, however, the trend turns. These figures seem mainly "M" for the double peak and "W" double bottom.
Double top
Double top formation formed by peaks in an upward trend and signaled that the previous trend is weakening and that buyers are losing momentum. First, the price becomes higher, but meeting resistance and retreat to the level of support. Then, the price makes a new attempt to rise, but meeting inability to break the line of resistance for the second time and again goes back to the level of support. The figure is completed when prices break through the support level and start a new downtrend.
This formation is a battle between bulls and bears. Buyers are trying to upload the price up, but found resistance that prevent them from continuing uptrend. After several attempts, buyers began to lose momentum and sellers are starting to prevail, pushing the price down to a new downtrend.
The signal for entering the deal comes after a real breakthrough line of support. Traders should check to increase the volume to confirm the attack. The aim is determined based on the distance from the base to the highest peak and is projected downward. In our example, the position can be closed at a profit at 1.2610. This figure has a high success rate, bringing projected profits.

Double bottom
Double bottom is a mirror image of the figure double top, showing a reversal of the downtrend in ascending. This formation includes a small peak surrounded by two almost equal bottoms (which do not differ by more than 3% or 4%). Double bottom occurs when the downward trend was reversed, after two attempts to reach the level of support. After the failed attempt to break price turns into a new upward trend.
The signal detection position appears when the price break the line of resistance, which is drawn through the top, which connects the two bottoms. This object is determined in the same manner as the double peak; The distance from top to bottom and is projected upward. In this case, the trader may profit at 1.2900 concluded.

Wedge
The wedge typically shows reversal of the trend, which is formed within the figure. The wedge is similar in structure to the symmetrical triangle, although approaching the wedge trend lines are inclined in the upward or downward, in contrast to the more homogeneous trend lines of the triangles. They also differ in meaning since the wedge is a longer-term formation. Wedges are divided into two types - up and down - as their main difference is in the slope of the formation.
Ascending wedge
The upward spike is usually considered bearish figure, indicating that the price will probably decrease. Approaching lines of support and resistance are in an upward direction. Since buyers are unable to raise the price higher and higher, sellers begin to pick up speed. The figure is completed when the price falls below the support level and sellers take control of the instrument.
The signal for the deal appears after a real breakthrough line of support. The objectives are defined like symmetrical triangles, using a bottom forming line of support. The first target point gain will be achieved in almost all cases (90%), the second point will be reached in 75% and the third 65% of cases.
Descending wedge
The downward wedge is bullish figure that suggests that the more likely the price to break up and form an uptrend. Trend lines are collected by both downhill as the price moves in a downtrend. The line resistance of the descending wedge is usually more severe than the line of support. A flattest support shows that sellers become weaker because cannot fail to push the price down.
The signal trading occurs after a real breakthrough line of resistance. It is important to make sure that the price has closed above the resistance. The objectives are defined by the peaks that form the line of resistance.
Head and shoulders
The formation head and shoulders is very popular among traders. This is a figure with three top that looks like a head with two shoulders. It usually signals a pending reversal, suggesting that the price will probably go against the previous trend. There are two types of head and shoulders - standard and reversed. Both show weakening trend with lower highs and lows.
Standard head and shoulders
The standard figure head and shoulders can be formed on top of an upward trend and this is an indication that the price will be lowered after its establishment. Head (central peak) stands above the shoulders (lower highs) that reach the same or very similar levels. Line support for all three tops is formed by connecting two bottoms and called neck.
The first lowest point suggests that demand for purchases begins to weaken. Investors who believe that the instrument is too low price, meet with purchase, followed by a flood of sales. This decline is followed by other percussion purchases that disappear earlier. Eventually the price drops to their true value below its original cost.
The figure is completed when after formation of the second shoulder neck is pierced. This is when most traders have to get into position. The goal is determined by calculating the distance between the top of the head and neck, and is projected downward to define the lower end, in this example 1.8150. After reaching this level, the price is expected to stop and turn.
Inverted head and shoulders
The figure reversed head and shoulders is formed during the downward trend and it is usually a signal that the price will rise after the figure is complete. Like the standard head and shoulders, this model consists of two shoulders and head - which is on the level of resistance.
Inverted head and shoulders is completed when price break neck. This signals the opening of the deal. The objective is defined in the same way as the standard figure; by measuring the distance between the head and neck and projecting upwards to determine a higher purpose, in this case 1.2830.
Double top and double bottom
Double top and double bottom are two of the most reliable reversal figures used to determine whether this trend can be reversed. These two figures show efforts to keep the price direction in the same trend. After several attempts, however, the trend turns. These figures seem mainly "M" for the double peak and "W" double bottom.
Double top
Double top formation formed by peaks in an upward trend and signaled that the previous trend is weakening and that buyers are losing momentum. First, the price becomes higher, but meeting resistance and retreat to the level of support. Then, the price makes a new attempt to rise, but meeting inability to break the line of resistance for the second time and again goes back to the level of support. The figure is completed when prices break through the support level and start a new downtrend.
This formation is a battle between bulls and bears. Buyers are trying to upload the price up, but found resistance that prevent them from continuing uptrend. After several attempts, buyers began to lose momentum and sellers are starting to prevail, pushing the price down to a new downtrend.
The signal for entering the deal comes after a real breakthrough line of support. Traders should check to increase the volume to confirm the attack. The aim is determined based on the distance from the base to the highest peak and is projected downward. In our example, the position can be closed at a profit at 1.2610. This figure has a high success rate, bringing projected profits.
Double bottom
Double bottom is a mirror image of the figure double top, showing a reversal of the downtrend in ascending. This formation includes a small peak surrounded by two almost equal bottoms (which do not differ by more than 3% or 4%). Double bottom occurs when the downward trend was reversed, after two attempts to reach the level of support. After the failed attempt to break price turns into a new upward trend.
The signal detection position appears when the price break the line of resistance, which is drawn through the top, which connects the two bottoms. This object is determined in the same manner as the double peak; The distance from top to bottom and is projected upward. In this case, the trader may profit at 1.2900 concluded.

Evgenia Gencheva- Administrator

- Posts : 153
Join date : 2016-09-02
Age : 40
Location : Milan, Italy
Page 1 of 1
Permissions in this forum:
You cannot reply to topics in this forum|
|
|