Determination of market movement with the levels of support and resistance
Page 1 of 1

Determination of market movement with the levels of support and resistance
![]() by Evgenia Gencheva Wed Oct 12, 2016 1:30 pm
by Evgenia Gencheva Wed Oct 12, 2016 1:30 pm
Determination of market movement with the levels of support and resistance
One of the most popular methods in technical analysis, used by both institutional and of individual traders is to determine the levels of resistance and support through etc. Pivot Point, which in turn is a starting point for defining the market sentiment as "bullish" or "bearish".
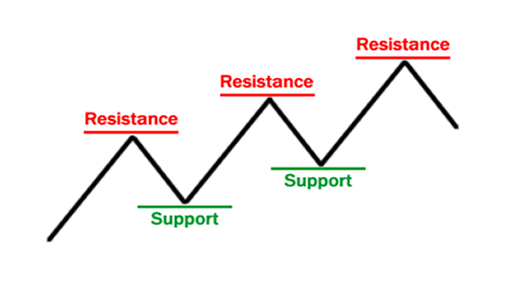
The levels of resistance and support are distinguished by their ability to limit the appreciation / depreciation of an asset. The most commonly used technical tools for determining the levels of support / resistance include: previous highs / lows, trend lines and trend channels, Moving Averages and Fibonacci Retracements.
Pivot Point (Starting point) is a technical indicator calculated as the average of the highest, lowest and closing price of a certain asset for the preceding time interval. This tool serves as levels of support or resistance depending on whether the price of the asset is currently under or over pivot point.
Pivot point should be the first thing to look at before trading. Just so you will be able to determine whether to go on long or short position and accordingly to establish goals and taillights. Generally, if prices are above the PP, market is considered bullish, and if they are below is considered bearish.
One of the most popular methods in technical analysis, used by both institutional and of individual traders is to determine the levels of resistance and support through etc. Pivot Point, which in turn is a starting point for defining the market sentiment as "bullish" or "bearish".
The levels of resistance and support are distinguished by their ability to limit the appreciation / depreciation of an asset. The most commonly used technical tools for determining the levels of support / resistance include: previous highs / lows, trend lines and trend channels, Moving Averages and Fibonacci Retracements.
Pivot Point (Starting point) is a technical indicator calculated as the average of the highest, lowest and closing price of a certain asset for the preceding time interval. This tool serves as levels of support or resistance depending on whether the price of the asset is currently under or over pivot point.
Pivot point should be the first thing to look at before trading. Just so you will be able to determine whether to go on long or short position and accordingly to establish goals and taillights. Generally, if prices are above the PP, market is considered bullish, and if they are below is considered bearish.

Evgenia Gencheva- Administrator

- Posts : 153
Join date : 2016-09-02
Age : 40
Location : Milan, Italy
Page 1 of 1
Permissions in this forum:
You cannot reply to topics in this forum