NASDAQ 100 - Oct 12, 2016
Page 1 of 1

NASDAQ 100 - Oct 12, 2016
![]() by Evgenia Gencheva Wed Oct 12, 2016 11:34 am
by Evgenia Gencheva Wed Oct 12, 2016 11:34 am
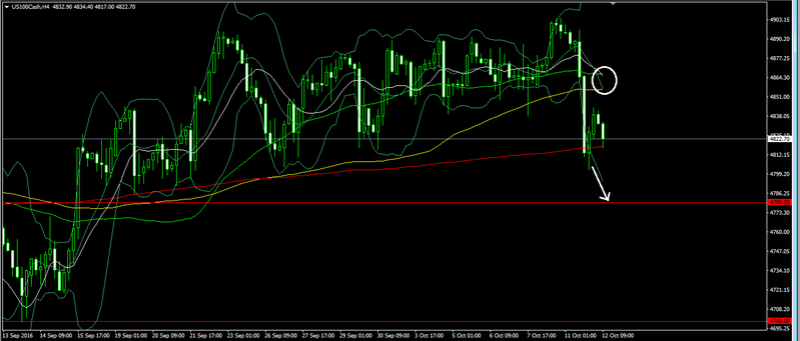
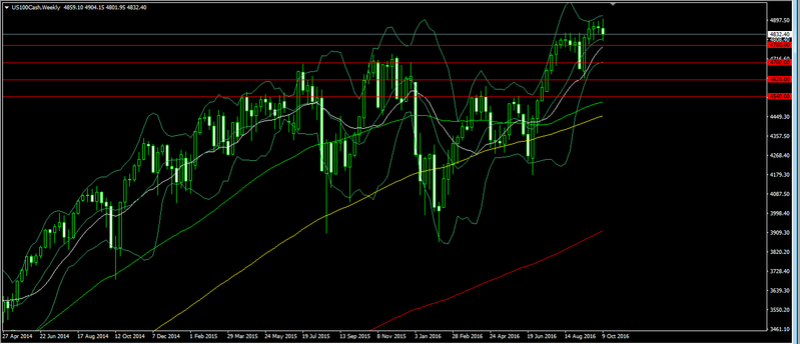
Nasdaq 100 is over support 4800 now, but on weekly and monthly charts moves in consolidation with range 4900 - 4540. Main support points below 4800 are 4780, 4700, 4620, 4540.
For today I expect test support to 4780, based on h4 chart, clear indications from lower bollinger 2:10 close and later today we will see crossing sma 50, sma 100 over the price, in result the price will fall below sma 200.
https://i.servimg.com/u/f97/19/53/74/92/forex_84.png
https://i.servimg.com/u/f97/19/53/74/92/forex_78.png

Evgenia Gencheva- Administrator

- Posts : 153
Join date : 2016-09-02
Age : 39
Location : Milan, Italy
Re: NASDAQ 100 - Oct 12, 2016
![]() by Evgenia Gencheva Wed Oct 12, 2016 7:13 pm
by Evgenia Gencheva Wed Oct 12, 2016 7:13 pm
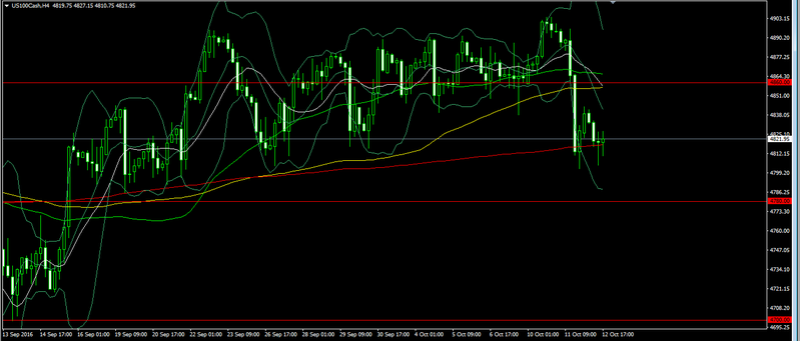
Nasdaq is stable over 4800 level, which means test to 4860. I see now sma 50, 100 h4 are still on big distance, even after few h4 candles from the morning.
Evgenia Gencheva- Administrator
- Posts : 153
Join date : 2016-09-02
Age : 39
Location : Milan, Italy
» NASDAQ 100 - Oct 20, 2016
» NASDAQ 100 - Oct 21, 2016
» NASDAQ 100 - Oct 17, 2016
» NASDAQ 100 - Oct 13, 2016
» NASDAQ 100 - Oct 28, 2016
» NASDAQ 100 - Oct 21, 2016
» NASDAQ 100 - Oct 17, 2016
» NASDAQ 100 - Oct 13, 2016
» NASDAQ 100 - Oct 28, 2016
Page 1 of 1
Permissions in this forum:
You cannot reply to topics in this forum|
|
|